22. Processing unstructured data#
22.1. Extracting accounting data from different document types#
22.1.1. JSON#
JSON stands for JavaScript Object Notation. It is a popular format for transporting and storing data, especially in web-page management. Python has a built-in library for encoding/decoding JSON files. In the following are basic examples how to use it.
import json
The format of JSON is very similar to a Python dictionary.
json_example = '{ "Company":"Nokia", "Country":"Finland", "ROA":0.12}'
loads() turns JSONs to dictionaries.
result_dict = json.loads(json_example)
result_dict
{'Company': 'Nokia', 'Country': 'Finland', 'ROA': 0.12}
result_dict['ROA']
0.12
dumps() can be used to change dictionaries to JSON objects.
pyth_dict = {"Company":"Apple", "Country":"USA", "ROA":0.17}
results_json = json.dumps(pyth_dict)
results_json # Notice the outer single quotation marks.
'{"Company": "Apple", "Country": "USA", "ROA": 0.17}'
More specifically, dumps() will change Python objects into JSON objects with the following rules:
Python dict to JSON object
Python list to JSON array
Python tuple to JSON array
Python string to JSON string
Python int to JSON number
Python float to JSON number
Python boolean to JSON boolean
Python None to JSON null
Very often, data providers set up API services to connect applications to databases. Often, these API services will use XML or JSON formats to exchange data between the client and the server. Therefore, it is essential to know how to read these files.
With json-library, you can use the built-in open() function to open a json file and json.loads() to transfer it to a Python object.
fd = open('company_tickers.json')
comp_dict = json.loads(fd.read())
list(comp_dict.items())[:10]
[('0', {'cik_str': 1750, 'ticker': 'AIR', 'title': 'AAR CORP'}),
 ('1', {'cik_str': 1800, 'ticker': 'ABT', 'title': 'ABBOTT LABORATORIES'}),
 ('2', {'cik_str': 1961, 'ticker': 'WDDD', 'title': 'WORLDS INC'}),
 ('3', {'cik_str': 2034, 'ticker': 'ACET', 'title': 'ACETO CORP'}),
 ('4', {'cik_str': 2034, 'ticker': 'ACETQ', 'title': 'ACETO CORP'}),
 ('5', {'cik_str': 2098, 'ticker': 'ACU', 'title': 'ACME UNITED CORP'}),
 ('6',
  {'cik_str': 2135,
   'ticker': 'ACS',
   'title': 'AFFILIATED COMPUTER SERVICES INC'}),
 ('7',
  {'cik_str': 2178,
   'ticker': 'AE',
   'title': 'ADAMS RESOURCES & ENERGY, INC.'}),
 ('8', {'cik_str': 2186, 'ticker': 'BKTI', 'title': 'BK Technologies Corp'}),
 ('9',
  {'cik_str': 2230,
   'ticker': 'ADX',
   'title': 'ADAMS DIVERSIFIED EQUITY FUND, INC.'})]
Pandas has also functios to read JSON objects
import pandas as pd
json_df = pd.read_json('company_tickers.json')
json_df
| 0 | 1 | 2 | 3 | 4 | 5 | 6 | 7 | 8 | 9 | ... | 13623 | 13624 | 13625 | 13626 | 13627 | 13628 | 13629 | 13630 | 13631 | 13632 | |
|---|---|---|---|---|---|---|---|---|---|---|---|---|---|---|---|---|---|---|---|---|---|
| cik_str | 1750 | 1800 | 1961 | 2034 | 2034 | 2098 | 2135 | 2178 | 2186 | 2230 | ... | 1787791 | 1788028 | 1788028 | 1788841 | 1789760 | 1789760 | 1789832 | 1790625 | 1791091 | 1791091 |
| ticker | AIR | ABT | WDDD | ACET | ACETQ | ACU | ACS | AE | BKTI | ADX | ... | JIH | AMHC | AMHCU | GRNV | CIIC | CIICU | HESM | LIVK | HCCO | HCCOU |
| title | AAR CORP | ABBOTT LABORATORIES | WORLDS INC | ACETO CORP | ACETO CORP | ACME UNITED CORP | AFFILIATED COMPUTER SERVICES INC | ADAMS RESOURCES & ENERGY, INC. | BK Technologies Corp | ADAMS DIVERSIFIED EQUITY FUND, INC. | ... | Juniper Industrial Holdings, Inc. | Amplitude Healthcare Acquisition Corp | Amplitude Healthcare Acquisition Corp | GreenVision Acquisition Corp. | CIIG Merger Corp. | CIIG Merger Corp. | Hess Midstream LP | LIV Capital Acquisition Corp. | Healthcare Merger Corp. | Healthcare Merger Corp. |
3 rows × 13633 columns
json_df.transpose()
| cik_str | ticker | title | |
|---|---|---|---|
| 0 | 1750 | AIR | AAR CORP |
| 1 | 1800 | ABT | ABBOTT LABORATORIES |
| 2 | 1961 | WDDD | WORLDS INC |
| 3 | 2034 | ACET | ACETO CORP |
| 4 | 2034 | ACETQ | ACETO CORP |
| ... | ... | ... | ... |
| 13628 | 1789760 | CIICU | CIIG Merger Corp. |
| 13629 | 1789832 | HESM | Hess Midstream LP |
| 13630 | 1790625 | LIVK | LIV Capital Acquisition Corp. |
| 13631 | 1791091 | HCCO | Healthcare Merger Corp. |
| 13632 | 1791091 | HCCOU | Healthcare Merger Corp. |
13633 rows × 3 columns
22.1.2. XML#
XML is another important format, when you are acquiring data from the web using APIs. The following link has a lot of information how to use Python to process XML documents.
https://docs.python.org/3/library/xml.etree.elementtree.html
22.1.3. XBLR#
XBLR is a very important data format for accounting/finance. It is an universal reporting standard that allows financial statement information to be downloaded directly into spreadsheets. The following links provide information how to process XBLR documents in Python.
https://pypi.org/project/python-xbrl/
https://www.codeproject.com/Articles/1227268/Accessing-Financial-Reports-in-the-EDGAR-Database
https://www.codeproject.com/Articles/1227765/Parsing-XBRL-with-Python
22.1.4. PDF#
Very often, the information from companies is in the form of pdf documents. For analysis in Python, they need to be changed to textual form. They are many ways to do that, like specialized software, webpages etc.
Python also has many libraries that can be used to process pdf documents. In my opinion, PDFMiner is one of the best ones.
Below is a code that can efficiently change PDF documents to textual form. I found it from the internet, so no credits for me.
from pdfminer.pdfparser import PDFParser
from pdfminer.pdfdocument import PDFDocument
from pdfminer.pdfpage import PDFPage
# From PDFInterpreter import both PDFResourceManager and PDFPageInterpreter
from pdfminer.pdfinterp import PDFResourceManager, PDFPageInterpreter
from pdfminer.pdfdevice import PDFDevice
# Import this to raise exception whenever text extraction from PDF is not allowed
from pdfminer.pdfpage import PDFTextExtractionNotAllowed
from pdfminer.layout import LAParams, LTTextBox, LTTextLine
from pdfminer.converter import PDFPageAggregator
def convert_pdfminer(fname):
        fp = open(fname, 'rb')
        parser = PDFParser(fp)
        doc = PDFDocument(parser)
        rsrcmgr = PDFResourceManager()
        laparams = LAParams()
        device = PDFPageAggregator(rsrcmgr, laparams=laparams)
        interpreter = PDFPageInterpreter(rsrcmgr, device)
        text = ''
        for page in PDFPage.create_pages(doc):
            interpreter.process_page(page)
            layout = device.get_result()
            for lt_obj in layout:
                if isinstance(lt_obj, LTTextBox) or isinstance(lt_obj, LTTextLine):
                    text += lt_obj.get_text()
        return text
22.2. Extracting data from the Internet#
22.2.2. Structured data#
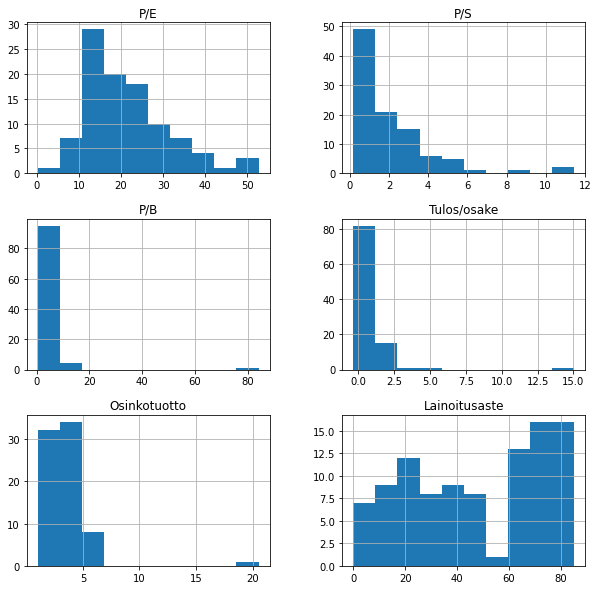
Below is an example that collects information from the internet to a structured format (dataframe) using Pandas read_html -function.
test_df = pd.read_html('https://www.nordnet.fi/markkinakatsaus/osakekurssit?selectedTab=keyFigures&sortField=pe&sortOrder=asc&exchangeCountry=FI',decimal=',')
work_df = pd.DataFrame()

work_df['Name'] = test_df[0]['Nimi']

work_df['P/E']= [i for [i,j] in test_df[0]['P/S'].str.split(' ')]

work_df['P/S']= [i for [i,j] in test_df[0]['P/B'].str.split(' ')]

work_df['P/B']= [i for [i,j] in test_df[0]['Tulos/osake'].str.split(' ')]

temp_list = []
for value in test_df[0]['Osinkotuotto']:
    try:
        temp_list.append(value.split(' ')[0])
    except:
        temp_list.append(value)

work_df['Tulos/osake'] = temp_list

temp_list = []
for value in test_df[0]['Osinko/osake']:
    try:
        temp_list.append(value.split(' ')[0])
    except:
        temp_list.append(value)

work_df['Osinkotuotto'] = temp_list

temp_list = []
for value in test_df[0]['Unnamed: 11']:
    try:
        temp_list.append(value.split(' ')[0])
    except:
        temp_list.append(value)

work_df['Lainoitusaste'] = temp_list
work_df
| Name | P/E | P/S | P/B | Tulos/osake | Osinkotuotto | Lainoitusaste | |
|---|---|---|---|---|---|---|---|
| 0 | Nexstim Oyj | 0.26 | 2.72 | 84.03 | 0.22 | – | 0 |
| 1 | Fondia Oyj | 7.61 | 1.46 | 4.93 | 0.97 | – | 10 |
| 2 | Sievi Capital plc | 8.38 | 4.88 | 0.89 | 0.12 | – | 0 |
| 3 | Scanfil Plc | 8.54 | 0.63 | 2.06 | 0.68 | 2.62 | 40 |
| 4 | Honkarakenne Oyj B | 8.58 | 0.46 | 1.72 | 0.43 | – | 10 |
| ... | ... | ... | ... | ... | ... | ... | ... |
| 95 | KONE Corporation | 39.22 | 3.67 | 12.74 | 1.81 | 2.39 | 85 |
| 96 | Gofore Plc | 42.74 | 2.63 | 5.78 | 0.3 | 1.56 | 10 |
| 97 | Aallon Group Oyj | 48.31 | 2.01 | 4.07 | 0.2 | 1.87 | 0 |
| 98 | Telia Company AB | 48.54 | 1.68 | 1.9 | 0.71 | 4.79 | 85 |
| 99 | LeadDesk Oyj | 52.63 | 8.53 | 13.76 | 0.41 | – | 10 |
100 rows × 7 columns
work_df['P/E'] = work_df['P/E'].astype('float')

work_df['P/S'] = work_df['P/S'].astype('float')

work_df['P/B'] = work_df['P/B'].astype('float')

work_df['Tulos/osake'].replace('–',np.nan,inplace=True)

work_df['Tulos/osake'] = work_df['Tulos/osake'].astype('float')

work_df['Osinkotuotto'].replace('–',np.nan,inplace=True)

work_df['Osinkotuotto'] = work_df['Osinkotuotto'].astype('float')

work_df['Lainoitusaste'].replace('–',np.nan,inplace=True)

work_df['Lainoitusaste'] = work_df['Lainoitusaste'].astype('float')
work_df.hist(figsize=(10,10))
plt.show()
22.3. Processing text data#
The straightforward way to process text data is to use regular expressions. They are very efficient, but unfortunately, very difficult. Luckily, many NLP libraries have good text processing tools available. Especially good is Natural Language Toolkit (https://www.nltk.org/).
22.3.1. Regular experssions#
22.4. Processing video and images#
22.4.1. Satellite data#
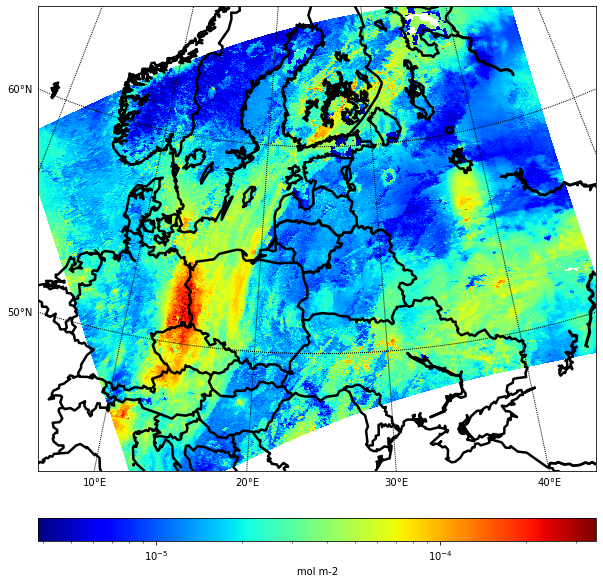
Below is an exaxmple, where NO2 observations from Sentinel 5P satellite (https://sentinel.esa.int/web/sentinel/missions/sentinel-5p) are processed to usable image form in Python.
from netCDF4 import Dataset
import numpy as np
import matplotlib.pyplot as plt
import seaborn as sns
ESA provides data from Sentinel satellites using NetCDF file format. From pro.arcgis.com: “NetCDF (network Common Data Form) is a file format for storing multidimensional scientific data (variables) such as temperature, humidity, pressure, wind speed, and direction. Each of these variables can be displayed through a dimension (such as time) in ArcGIS by making a layer or table view from the netCDF file.”
my_example_nc_file = 'S5P_NRTI_L2__NO2____20200309T105605_20200309T110105_12457_01_010302_20200309T114222.nc'
fh = Dataset(my_example_nc_file, mode='r')
print(fh.groups['PRODUCT'].variables['nitrogendioxide_tropospheric_column_precision'])
<class 'netCDF4._netCDF4.Variable'>
float32 nitrogendioxide_tropospheric_column_precision(time, scanline, ground_pixel)
    units: mol m-2
    standard_name: troposphere_mole_content_of_nitrogen_dioxide standard_error
    long_name: Precision of the tropospheric vertical column of nitrogen dioxide
    coordinates: longitude latitude
    multiplication_factor_to_convert_to_molecules_percm2: 6.022141e+19
    _FillValue: 9.96921e+36
path = /PRODUCT
unlimited dimensions:
current shape = (1, 373, 450)
filling on
lons = fh.groups['PRODUCT'].variables['longitude'][:][0,:,:]
lats = fh.groups['PRODUCT'].variables['latitude'][:][0,:,:]
no2 = fh.groups['PRODUCT'].variables['nitrogendioxide_tropospheric_column_precision'][0,:,:]
print (lons.shape)
print (lats.shape)
print (no2.shape)
(373, 450)
(373, 450)
(373, 450)
no2_units = fh.groups['PRODUCT'].variables['nitrogendioxide_tropospheric_column_precision'].units
no2_units
'mol m-2'
from matplotlib.colors import LogNorm
from mpl_toolkits.basemap import Basemap
lon_0 = lons.mean()
lat_0 = lats.mean()

m = Basemap(width=3000000,height=2500000,
            resolution='l',projection='stere',lat_0=lat_0,lon_0=lon_0)

xi, yi = m(lons, lats)
plt.figure(figsize=(10,10))
cs = m.pcolor(xi,yi,np.squeeze(no2),norm=LogNorm(), cmap='jet')
m.drawparallels(np.arange(-80., 81., 10.), labels=[1,0,0,0], fontsize=10)
m.drawmeridians(np.arange(-180., 181., 10.), labels=[0,0,0,1], fontsize=10)

# Add Coastlines, States, and Country Boundaries
m.drawcoastlines(linewidth=2.5)
m.drawcountries(linewidth=2.5)
cbar = m.colorbar(cs, location='bottom', pad="10%")
cbar.set_label(no2_units)
plt.savefig('test.png')
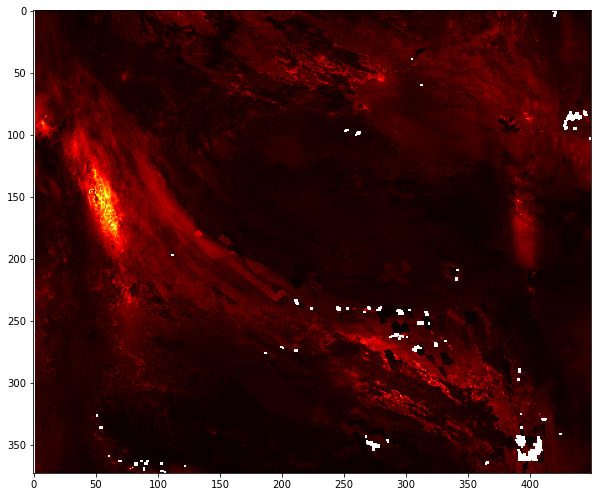
plt.figure(figsize=(10,10))
plt.imshow(no2,cmap='hot')
<matplotlib.image.AxesImage at 0x173bea96488>
22.2.1. Social media#
Tweepy is an excellent library for Twitter API.
You need a permission from Twitter to use their API. In return, they will send you the necessary keys to use the API. Replace Customer user key and Customer secret key with your personal keys.